- Main
- Vision, Values & Mission
- Corporate Profile
- WSD Organisation Chart
- Events in Brief
- Director’s Statement
- Key Performance Indicators
- Total Water Management Strategy
- Water Supply Management
- Water Demand Management
- Waterworks Infrastructure
- Finance and Water Charges
- Sustainable Operations
- Focusing on Customer Service
- Shaping Our Future
- Appendices and Annexes
- Download full report
(PDF 22MB)


Appendices
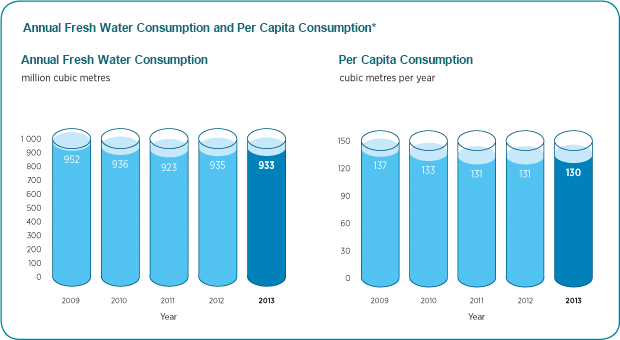
- IAnnual Fresh Water Consumption and Per Capita Consumption
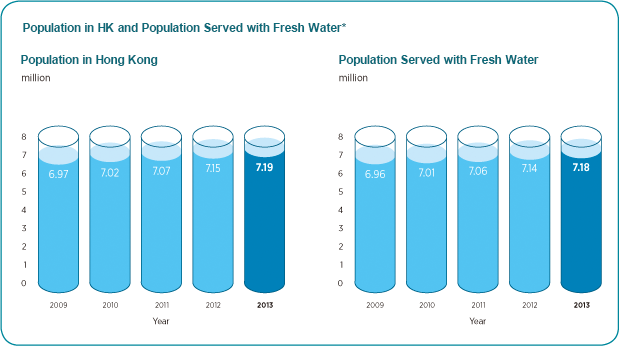
- IIPopulation in HK and Population Served with Fresh Water
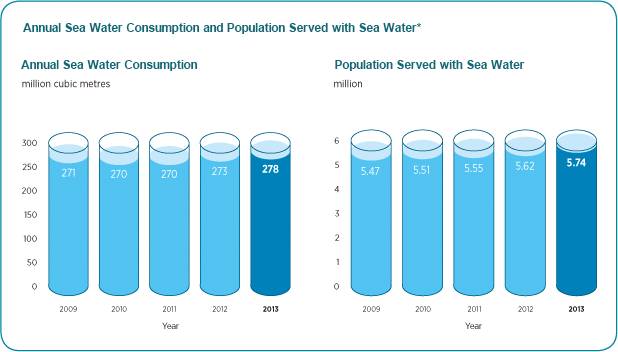
- IIIAnnual Sea Water Consumption and Population Served with Sea Water
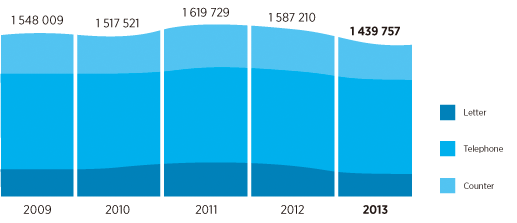
- IVStatistics on Customer Enquires and Requests for Services
- VStatistics on Customer Complaints
- VIStatistics on Mode Payment 2013/14
Annexes
- IList of WSD Publications Available to the Public
- IICustomer Enquiry Centres
- IIIDrinking Water Quality for the Period of April 2013 – March 2014
- IVWater Authority – Operating Accounts
Appendices
Appendix I
Appendix II
Appendix III
Based on the population benchmark from the results of the 2011 Population Census, the population figures from mid-2007 to mid-2011 have been revised. The revision has incorporated more estimates of population changes that were not yet available at the time when the previous population figures were prepared. Consequently, the per capita consumption figures and population served from 2007 onwards have been revised as well.
Appendix IV

| Year | 2009 | 2010 | 2011 | 2012 | 2013 |
|---|---|---|---|---|---|
| Letter | 261 347 | 279 676 | 318 986 | 295 016 | 212 566 |
| Telephone | 902 314 | 888 857 | 901 758 | 896 956 | 897 424 |
| Counter | 384 348 | 348 988 | 398 985 | 395 238 | 329 767 |
| Total | 1 548 009 | 1 517 521 | 1 619 729 | 1 587 210 | 1 439 757 |
number of requests

Appendix V
number of complaints
number of complaints
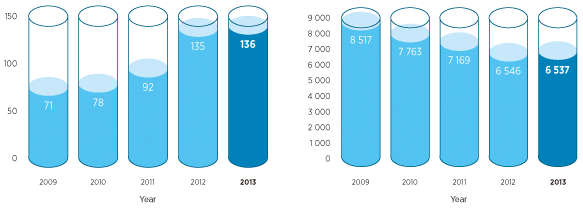
| Year | 2009 | 2010 | 2011 | 2012 | 2013 |
|---|---|---|---|---|---|
| Account-Related# | 71 | 78 | 92 | 135 | 136 |
| Non-Account-Related | 8 517 | 7 763 | 7 169 | 6 546 | 6 537 |
| Total | 8 588 | 7 841 | 7 261 | 6 681 | 6 673 |
* Account-related complaints from District Councils, Legco and Ombudsman.
Appendix VI
| Mode of Payment | No. of Cases | Percentage (%) |
|---|---|---|
| In person | 3 704 900 | 49.8 |
| By post | 101 500 | 1.3 |
| Autopay | 855 000 | 11.5 |
| PPS | 861 900 | 11.6 |
| ATM | 441 400 | 5.9 |
| Internet | 1 482 000 | 19.9 |
| Total | 7 446 700 | 100.0 |
Annexes
Annex I
List of WSD Publications Available to the Public
All publications are available on the WSD homepage and in both English and Chinese except where indicated.
Publications
Available at the online Government Bookstore
- Hong Kong’s Water
- Waterworks Ordinance and Regulations
Pamphlets/Leaflets/Booklets
Available free at all Customer Enquiry Centres
- Employment of Licensed Plumbers
- A Guide to Cleansing of Fresh Water Storage Tanks
- Proper Use of Fire Fighting Hose Reels in Buildings
- How to Apply for Water Supply
- Installation of Electric Thermal Storage Type Water Heater for Domestic Purpose
- Maintenance of Water Supply Systems in Private Housing Estates/Buildings
- Performance Pledge
- Facts About Water
- Waterlink Newsletter
- Consumer Guide Book
- Fun of Fishing in Hong Kong Reservoirs
- Quality Water Recognition Scheme for Buildings Brief Introduction
- Fresh Water Plumbing Maintenance Guide
- Electronic Services*
- Effect of Red Tides on Seawater for Toilet Flushing
- Unlawful Taking of Water Is Prohibited
- Departmental Leaflet*
- Meter Testing Laboratory
- Advice for Consumers on High Consumption
- Water Treatment and Quality Control in Hong Kong
- Water Supply Technical Fault Complaints
- Consumer’s Responsibility
- Guidelines on Water Supply Application for Food Business (Restaurant/Kitchen)
Available Upon Request or Available at WSD Headquarters
- Total Water Management in Hong Kong
- Key Facts
- Au Tau Water Treatment Works
- Sha Tin Water Treatment Works
- Ma On Shan Water Treatment Works
- Pak Kong Water Treatment Works
- Ngau Tam Mei Water Treatment Works
- Tai Po Water Treatment Works
- Siu Ho Wan Water Treatment Works
- Tai Tam Waterworks Heritage Trail
- Tai Tam Tuk Raw Water Pumping Station
- Leaflet on “Little Drop’s Marvellous Journey”
- Warning Sticker – Misuse of Flushing Water
- Warning Sticker – Misuse of Fire Services Water
- Sticker – “Treasure every drop”
- Poster on “Water Conservation Starts from Home” in 5 Languages (Chinese/English/Indonesian/Tagalog/Thai)
- Poster on “Inspect and maintain plumbing regularly to prevent water leaks”
- Poster on “Quality Water Recognition Scheme for Buildings”
- Poster on “Save Water for the Future Every Drop Counts”
- Poster on “Save Water Take Shorter Showers”
- Leaflet to Trade on “Water Efficiency Labelling Scheme – Showers for Bathing” *
- Leaflet to Public on “Water Efficiency Labelling Scheme – Showers for Bathing”
- Leaflet to Trade on “Water Efficiency Labelling Scheme – Water Taps” *
- Leaflet to Public on “Water Efficiency Labelling Scheme – Water Taps”
- Leaflet to Trade on “Water Efficiency Labelling Scheme – Washing Machines” *
- Leaflet to Public on “Water Efficiency Labelling Scheme – Washing Machines”
- Leaflet to Trade on “Water Efficiency Labelling Scheme – Urinal Equipment”
- Leaflet on “Water Conservation Starts from Home” (Chinese/English/Indonesian/Tagalog/Thai)
- Annual Report – Water Supplies Department 2012 – 2013
- Annual Report – Water Supplies Department 2011 – 2012
- Annual Report – Water Supplies Department 2010 – 2011
- Annual Report – Water Supplies Department 2009 – 2010
- Annual Report – Water Supplies Department 2008 – 2009
- Annual Report – Water Supplies Department 2007 – 2008
- Annual Report – Water Supplies Department 2006 – 2007
- Annual Report – Water Supplies Department 2005 – 2006
- Annual Report – Water Supplies Department 2004 – 2005
- Annual Report – Water Supplies Department 2003 – 2004
- Annual Report – Water Supplies Department 2002 – 2003
- Annual Report – Water Supplies Department 2001 – 2002
- Annual Report – Water Supplies Department 2000 – 2001
- Annual Report – Water Supplies Department 1999 – 2000
- Annual Report – Water Supplies Department 1998 – 1999
* Not yet available on WSD homepage
Available on WSD Homepage Only
- General Information on the Use of Different Types of (Corrosion Resistant Pipe) Materials as Inside Service in Buildings
- Installation Notes of Different Types of Corrosion Resistant Pipe Materials as Inside Service in Buildings
- Hong Kong Waterworks Standard Requirements for Plumbing Installation in Buildings
- WSD Circular Letters
- Handbook on Plumbing Installation for Buildings
Annex II
Customer Enquiry Centres
Hong Kong-
Wan Chai Customer Enquiry Centre
1/F Immigration Tower, 7 Gloucester Road, Wan Chai
-
Mong Kok Customer Enquiry Centre
G/F 128 Sai Yee Street, Mong Kok
-
Tai Po Customer Enquiry Centre
4/F Tai Po Government Offices, 1 Ting Kok Road, Tai Po
-
Sha Tin Customer Enquiry Centre
3/F Sha Tin Government Offices, 1 Sheung Wo Che Road, Sha Tin
-
Tuen Mun Customer Enquiry Centre
7/F Tuen Mun Government Offices, 1 Tuen Hi Road, Tuen Mun
Annex III
Drinking Water Quality for the Period of April 2013 – March 2014
Part A. Microbiological quality
General Points
- Hong Kong enjoys one of the safest water supplies in the world. Since August 2012, we have begun monitoring the quality of our drinking water according to the World Health Organization’s (WHO) Guidelines for Drinking-water Quality (2011). The WHO recommends a set of Guideline Values (GVs) representing the concentration of constituents in drinking water that will not result in any significant health risk to a consumer weighing 60 kg over a lifetime consumption of 2 litres per day for 70 years.
- In extreme cases of contamination, we will take concerted actions with the Department of Health. The public will be informed to take appropriate measures if necessary.
- Samples were taken at water treatment works, service reservoirs, connection points and consumer taps and analysed on site and in WSD’s laboratories by WSD’s qualified staff.
- During this period, over 26 000 treated water samples were taken for microbiological analyses.
- The drinking water quality for this period fully complied with the World Health Organization’s Guidelines for Drinking-water Quality (2011).
- Compliance is based on the annual average of monitoring data in accordance with international practices.
| Parameter | Unit | Monitoring Data (04/2013 – 03/2014) | WHO 2011 Guideline Value | Compliance | ||
|---|---|---|---|---|---|---|
| Minimum | Maximum | Average | ||||
| E. coli | cfu* per 100 mL | 0 | 0 | 0 | 0 | ✔ |
| Total Coliforms# | cfu* per 100 mL | 0 | 0 | 0 | – | – |
| Cryptosporidium@ | no. of oocyst per L | 0.00 | 0.00 | 0.00 | – | – |
| Giardia | no. of cyst per L | 0.00 | 0.00 | 0.00 | – | – |
- *
colony forming unit (cfu)
- #
WHO 2011 has not established health-related GV for Total Coliforms.
- @
Although the WHO has not established any health-related GV for cryptosporidium or giardia in drinking water, we also monitor for these organisms. The monitoring data of 0.00 per litre represents no oocyst or cyst detected in a volume of not less than 100 litres of treated water sample.
Part B.Chemicals of health significance as described by World Health Organization’s Guidelines for Drinking-water Quality 2011
General Points
- Hong Kong enjoys one of the safest water supplies in the world. Since August 2012, we have begun monitoring the quality of our drinking water according to the World Health Organization’s (WHO) Guidelines for Drinking-water Quality (2011). The WHO recommends a set of Guideline Values (GVs) representing the concentration of constituents in drinking water that will not result in any significant health risk to a consumer weighing 60 kg over a lifetime consumption of 2 litres per day for 70 years.
- Some GVs are recommended by WHO as provisional GVs where available health effect information is limited.
- Occasional deviations above the WHO GVs do not mean that the water is unsuitable for consumption. Large safety margins have been allowed for in the derivation of the GVs.
- In extreme cases of contamination, we will take concerted actions with the Department of Health. The public will be informed to take appropriate measures if necessary.
- Samples were taken at water treatment works, service reservoirs, connection points and consumer taps and analysed on site and in WSD’s laboratories by WSD’s qualified staff.
- The drinking water quality for this period fully complied with the World Health Organization’s Guidelines for Drinking-water Quality (2011).
- Compliance is based on the annual average of monitoring data in accordance with international practice.
| Parameter | Unit | Monitoring Data (04/2013 – 03/2014) | WHO 2011 Guideline Value | Compliance | ||
|---|---|---|---|---|---|---|
| Minimum | Maximum | Average | ||||
| Acrylamide | μg/L | < 0.4 | < 0.4 | < 0.4 | 0.5 | ✔ |
| Alachlor | μg/L | < 5.0 | < 5.0 | < 5.0 | 20 | ✔ |
| Aldicarb | μg/L | < 2.5 | < 2.5 | < 2.5 | 10 | ✔ |
| Aldrin and Dieldrin | μg/L | < 0.008 | < 0.008 | < 0.008 | 0.03 | ✔ |
| Antimony | mg/L | < 0.001 | < 0.001 | < 0.001 | 0.02 | ✔ |
| Arsenic | mg/L | < 0.001 | < 0.001 | < 0.001 | 0.01 (A,T) | ✔ |
| Atrazine and its chloro-striazine metabolites | μg/L | < 25 | < 25 | < 25 | 100 | ✔ |
| Barium | mg/L | 0.004 | 0.030 | 0.015 | 0.7 | ✔ |
| Benzene | μg/L | < 2.5 | < 2.5 | < 2.5 | 10 | ✔ |
| Benzo(a)pyrene | μg/L | < 0.0020 | < 0.0020 | < 0.0020 | 0.7 | ✔ |
| Boron | mg/L | < 0.02 | 0.05 | 0.02 | 2.4 | ✔ |
| Bromate | μg/L | < 2.5 | 4.0 | < 2.5 | 10 (A,T) | ✔ |
| Bromodichloromethane | μg/L | < 15 | 20 | < 15 | 60 | ✔ |
| Bromoform | μg/L | < 25 | < 25 | < 25 | 100 | ✔ |
| Cadmium | mg/L | < 0.001 | < 0.001 | < 0.001 | 0.003 | ✔ |
| Carbofuran | μg/L | < 1.2 | < 1.2 | < 1.2 | 7 | ✔ |
| Parameter | Unit | Monitoring Data (04/2013 – 03/2014) | WHO 2011 Guideline Value | Compliance | ||
|---|---|---|---|---|---|---|
| Minimum | Maximum | Average | ||||
| Carbon tetrachloride | μg/L | < 0.5 | < 0.5 | < 0.5 | 4 | ✔ |
| Chlorate | μg/L | < 175 | < 175 | < 175 | 700 (D) | ✔ |
| Chlordane | μg/L | < 0.050 | < 0.050 | < 0.050 | 0.2 | ✔ |
| Chlorine | mg/L | < 0.1 | < 1.4 | < 0.7 | 5 (C) | ✔ |
| Chlorite | μg/L | < 50 | < 50 | < 50 | 700 (D) | ✔ |
| Chloroform | μg/L | < 50 | < 50 | < 50 | 300 | ✔ |
| Chlorotoluron | μg/L | < 7.5 | < 7.5 | < 7.5 | 30 | ✔ |
| Chlorpyrifos | μg/L | < 7.5 | < 7.5 | < 7.5 | 30 | ✔ |
| Chromium | mg/L | < 0.001 | < 0.001 | < 0.001 | 0.05 (P) | ✔ |
| Copper | mg/L | < 0.003 | < 0.058 | < 0.003 | 2 | ✔ |
| Cyanazine | μg/L | < 0.15 | 0.15 | 0.15 | 0.6 | ✔ |
| 2,4-D (or 2,4-dichlorophenoxyacetic acid) | μg/L | < 7.5 | 7.5 | < 7.5 | 30 | ✔ |
| 2,4-DB (or 4-(2,4-dichlorophenoxy) butyric acid) | μg/L | < 22 | < 22 | < 22 | 90 | ✔ |
| DDT and metabolites | μg/L | < 0.50 | < 0.50 | < 0.50 | 1 | ✔ |
| Di(2-ethylhexyl) phthalate | μg/L | < 2 | < 2 | < 2 | 8 | ✔ |
| Parameter | Unit | Monitoring Data (04/2013 – 03/2014) | WHO 2011 Guideline Value | Compliance | ||
|---|---|---|---|---|---|---|
| Minimum | Maximum | Average | ||||
| Dibromochloromethane | μg/L | < 25 | < 25 | < 25 | 70 | ✔ |
| Dibromochloromethane | μg/L | < 25 | < 25 | < 25 | 100 | ✔ |
| 1,2-Dibromo-3-chloropropane | μg/L | < 0.25 | < 0.25 | < 0.25 | 1 | ✔ |
| 1,2-Dibromoethane | μg/L | < 0.10 | < 0.10 | < 0.10 | 0.4 (P) | ✔ |
| Dichloroacetate | μg/L | < 12 | 18 | < 12 | 50 (D) | ✔ |
| Dichloroacetonitrile | μg/L | < 5.0 | < 5.0 | < 5.0 | 20 (P) | ✔ |
| 1,2-Dichlorobenzene | μg/L | < 250 | < 250 | < 250 | 1000 (C) | ✔ |
| 1,4-Dichlorobenzene | μg/L | < 75 | < 75 | < 75 | 300 (C) | ✔ |
| 1,2-Dichloroethane | μg/L | < 7.5 | < 7.5 | < 7.5 | 30 | ✔ |
| 1,2-Dichloroethene | μg/L | < 12 | < 12 | < 12 | 50 | ✔ |
| Dichloromethane | μg/L | < 5.0 | < 5.0 | < 5.0 | 20 | ✔ |
| 1,2-Dichloropropane | μg/L | < 5.0 | < 5.0 | < 5.0 | 40 (P) | ✔ |
| 1,3-Dichloropropene | μg/L | < 5.0 | < 5.0 | < 5.0 | 20 | ✔ |
| Dichlorprop (or 2,4-DP) | μg/L | < 25 | < 25 | < 25 | 100 | ✔ |
| Dimethoate | μg/L | < 1.5 | < 1.5 | < 1.5 | 6 | ✔ |
| 1,4-Dioxane | μg/L | < 12.5 | < 12.5 | < 12.5 | 50 | ✔ |
| Edetic acid (EDTA) | μg/L | < 50 | < 50 | < 50 | 600 | ✔ |
| Parameter | Unit | Monitoring Data (04/2013 – 03/2014) | WHO 2011 Guideline Value | Compliance | ||
|---|---|---|---|---|---|---|
| Minimum | Maximum | Average | ||||
| Endrin | μg/L | < 0.15 | < 0.15 | < 0.15 | 0.6 | ✔ |
| Epichlorohydrin | μg/L | < 0.4 | < 0.4 | < 0.4 | 0.4 (P) | ✔ |
| Ethylbenzene | μg/L | < 75 | < 75 | < 75 | 300 (C) | ✔ |
| Fenoprop (or 2,4,5-TP) | μg/L | < 2.2 | < 2.2 | < 2.2 | 9 | ✔ |
| Fluoride | mg/L | 0.15 | 0.69 | 0.48 | 1.5 | ✔ |
| Hexachlorobutadiene | μg/L | < 0.15 | < 0.15 | < 0.15 | 0.6 | ✔ |
| Hydroxyatrazine | μg/L | < 50 | < 50 | < 50 | 200 | ✔ |
| Isoproturon | μg/L | < 2.2 | < 2.2 | < 2.2 | 9 | ✔ |
| Lead | mg/L | < 0.001 | < 0.003 | < 0.001 | 0.01 (A,T) | ✔ |
| Lindane | μg/L | < 0.50 | < 0.50 | < 0.50 | 2 | ✔ |
| MCPA (or 4-(2-methyl-4-chlorophenoxy) acetic acid) | μg/L | < 2.0 | < 2.0 | < 2.0 | 3 | ✔ |
| Mecoprop (or MCPP) | μg/L | < 2.5 | < 2.5 | < 2.5 | 10 | ✔ |
| Mercury | mg/L | < 0.00005 | < 0.00005 | < 0.00005 | 0.006 | ✔ |
| Methoxychlor | μg/L | < 5.0 | < 5.0 | < 5.0 | 20 | ✔ |
| Metolachlor | μg/L | < 2.5 | < 2.5 | < 2.5 | 10 | ✔ |
| Microcystin-LR (total) | μg/L | < 0.5 | < 0.5 | < 0.5 | 1 (P) | ✔ |
| Molinate | μg/L | < 1.5 | < 1.5 | < 1.5 | 6 | ✔ |
| Parameter | Unit | Monitoring Data (04/2013 – 03/2014) | WHO 2011 Guideline Value | Compliance | ||
|---|---|---|---|---|---|---|
| Minimum | Maximum | Average | ||||
| Monochloramine | mg/L | < 1.0 | < 1.0 | < 1.0 | 3 | ✔ |
| Monochloroacetate | μg/L | < 10 | < 10 | < 10 | 20 | ✔ |
| Nickel | mg/L | < 0.001 | 0.016 | 0.003 | 0.07 | ✔ |
| Nitrate (as NO3-) | mg/L | < 2.5 | 16 | 4.7 | 50 | ✔ |
| Nitrilotriacetic acid | μg/L | < 50 | < 50 | < 50 | 200 | ✔ |
| Nitrite (as NO2-) | mg/L | < 0.004 | 0.028 | < 0.004 | 3 | ✔ |
| N-Nitrosodimethylamine | μg/L | < 0.025 | < 0.025 | < 0.025 | 0.1 | ✔ |
| Pendimethalin | μg/L | < 5.0 | < 5.0 | < 5.0 | 20 | ✔ |
| Pentachlorophenol | μg/L | < 2.2 | < 2.2 | < 2.2 | 9 (P) | ✔ |
| Selenium | mg/L | < 0.003 | < 0.003 | < 0.003 | 0.04 (P) | ✔ |
| Simazine | μg/L | < 0.50 | < 0.50 | < 0.50 | 2 | ✔ |
| Sodium dichloroisocyanurate (as cyanuric acid) | mg/L | < 10 | < 10 | < 10 | 40 | ✔ |
| Styrene | μg/L | < 5.0 | < 5.0 | < 5.0 | 20 (C) | ✔ |
| 2,4,5-T (or 2,4,5-trichlorophenoxy acetic acid) | μg/L | < 2.2 | < 2.2 | < 2.2 | 9 | ✔ |
| Terbuthylazine | μg/L | < 1.8 | < 1.8 | < 1.8 | 7 | ✔ |
| Tetrachloroethene | μg/L | < 10 | < 10 | < 10 | 40 | ✔ |
| Parameter | Unit | Monitoring Data (04/2013 – 03/2014) | WHO 2011 Guideline Value | Compliance | ||
|---|---|---|---|---|---|---|
| Minimum | Maximum | Average | ||||
| Toluene | μg/L | < 175 | < 175 | < 175 | 700 (C) | ✔ |
| Trichloroacetate | μg/L | < 25 | < 25 | < 25 | 200 | ✔ |
| Trichloroethene | μg/L | < 18 | < 18 | < 18 | 20 (P) | ✔ |
| 2,4,6-Trichlorophenol | μg/L | < 50 | < 50 | < 50 | 200 (C) | ✔ |
| Trifluralin | μg/L | < 5.0 | < 5.0 | < 5.0 | 20 | ✔ |
| Uranium | μg/L | < 0.00002 | 0.00008 | < 0.00002 | 0.03 (P) | ✔ |
| Vinyl chloride | μg/L | < 0.2 | < 0.2 | < 0.2 | 0.3 | ✔ |
| Xylenes | μg/L | < 125 | < 125 | < 125 | 500 (C) | ✔ |
Note:
- (1) This is a summary report on drinking water quality.
- (2) All values are compiled in accordance with requirements stipulated by the current quality assurance protocol of the Water Science Division of WSD.
- (3) For heavy metals and trace organics, 100-300 samples per parameter have been analysed
- (4) According to WHO 2011:
- P =
provisional guideline value because of uncertainties in the health database.
- T =
provisional guideline value as calculated guideline value is below the level that can be achieved through practical treatment methods, source protection, etc.
- A =
provisional guideline value as calculated guideline value is below the achievable quantification level.
- D =
provisional guideline value as disinfection may result in the guideline value being exceeded.
- C =
concentrations of the substance at or below the health-based guideline value may affect the appearance, taste or odour of the water, leading to consumer complaints.
- P =
Part C. Radiological quality
General Points
- Hong Kong enjoys one of the safest water supplies in the world. The Water Supplies Department (WSD) monitors the quality of drinking water supply according to the World Health Organization’s (WHO) Guidelines for Drinking-water Quality (2011).
- According to the recommendation of the WHO, the screening levels for drinking water are 0.5 Bq/L for gross alpha activity and 1.0 Bq/L for gross beta activity respectively as noted below. No further investigation or detailed analysis for specific radionuclides is required.
- Samples were taken at water treatment works, distribution networks and consumer taps and analysed in WSD’s laboratories by WSD’s qualified staff.
- During this period, the radioactivity level of drinking water was well below the screening levels for gross alpha and gross beta activities as recommended by the WHO 2011, and was safe for consumption.
| Parameter | Unit | Monitoring Data (04/2013 – 03/2014) | WHO 2011 Guideline Value | Compliance | ||
|---|---|---|---|---|---|---|
| Minimum | Maximum | Average | ||||
| Gross alpha activity | Bq/L | < 0.1 | < 0.1 | < 0.1 | 0.5 | ✔ |
| Gross beta activity | Bq/L | < 0.1 | < 0.1 | < 0.1 | 1.0 | ✔ |
Note:
- (1) This is a summary report on drinking water quality.
- (2) Reporting values for gross alpha and gross beta activities are set at 20% of their respective WHO screening levels.
- (3) Over 150 samples have been analysed for gross alpha and gross beta activities
Part D. Other parameters
| Parameter | Unit | Monitoring Data (04/2013 – 03/2014) | ||
|---|---|---|---|---|
| Minimum | Maximum | Average | ||
| pH at 25°C | pH | 6.4 | 9.2 | 8.5 |
| Colour | Hazen unit | < 3 | < 3 | < 3 |
| Turbidity | NTU | < 0.1 | 2.9 | 0.3 |
| Conductivity at 25°C | μS/cm | 58 | 203 | 126 |
| Temperature | °C | 12.3 | 31.2 | 23.1 |
| Total alkalinity (as CaCO3) | mg/L | 7 | 35 | 21 |
| Total hardness (as CaCO3) | mg/L | < 5 | 62 | 32 |
| Calcium | mg/L | 0.7 | 20 | 11 |
| Magnesium | mg/L | 0.31 | 2.3 | 1.4 |
| Chloride | mg/L | < 5 | 18 | 9 |
| Sulphate | mg/L | 5 | 26 | 12 |
| Ortho-phosphates (as PO4) | mg/L | < 0.01 | 0.05 | < 0.01 |
| Iron | mg/L | < 0.01 | 0.15 | < 0.01 |
| Aluminium | mg/L | < 0.01 | 0.31 | 0.03 |
| Silica (as SiO2) | mg/L | 2.2 | 14 | 10 |
| Manganese | mg/L | < 0.01 | 0.05 | < 0.01 |
Note:
- (1) This is a summary report on drinking water quality.
- (2) All values are compiled in accordance with requirements stipulated by the current quality assurance protocol of the Water Science Division of WSD.
Annex IV
Water Authority – Operating Accounts
For the year ended 31 March 2014
| Activities |
|---|
| Metered fresh water consumption increased by 0.9% to 637 million cubic metres |
| Financial Performance |
|---|
| Revenue increased by 6.2% |
| Expenditure increased by 4.5% |
| The deficit decreased from $1,007.7 million in 2012-13 to $930.9 million in 2013-14 |
| Return on Average Net Fixed Assets slightly improved to -1.9% |
For the year ended 31 March 2014
| 2014 | 2013 | ||
|---|---|---|---|
| Note | $M | $M | |
| Revenue | 2 | 7,630.6 | 7,187.8 |
| Expenditure | 3 | 8,561.5 | 8,195.5 |
| Deficit before taxation | (930.9) | (1,007.7) | |
| Taxation | 1(e) & (f) and 4 | - | - |
| Deficit after taxation | 1(j) | (930.9) | (1,007.7) |
The annexed notes form part of these accounts.
For the year ended 31 March 2014
| 2014 | 2013 | ||
|---|---|---|---|
| Note | $M | $M | |
| Average net fixed assets (ANFA) | 1(i) and 5 | 50,086.9 | 46,941.6 |
| Actual return | 3 | (930.9) | (1,007.7) |
| Target return | 1,703.0 | 1,596.0 | |
| Actual return as % of ANFA | 1(h) | (1.9%) | (2.1%) |
| Target return as % of ANFA | 3.4% | 3.4% |
The annexed notes form part of these accounts.
As at 31 March 2014
| 2014 | 2013 | ||
|---|---|---|---|
| Note | $M | $M | |
| Net assets employed | |||
| Fixed assets | 1(b) & (c) and 5 | 51,869.3 | 48,304.5 |
| Current assets | 1(d) and 6 | 2,427.4 | 2,307.9 |
| Current liabilities | 7 | (2,243.2) | (2,123.9) |
| Net current assets | 184.2 | 184.0 | |
| 52,053.5 | 48,488.5 | ||
| Financed by | |||
| Public capital account | 1(j) and 8 | 52,053.5 | 48,488.5 |
The annexed notes form part of these accounts.
Notes on the Accounts
1. Accounting Policies
-
(a)
Basis of Accounting
The accounts have been prepared on the historical cost basis of accounting modified to include notional receipts and payments.
-
(b)
Fixed Assets(i)No cost is included for land which is occupied by installations or sterilised by catchment areas except that, where it has been resumed, the cost of resumption has been included in the capital cost of the project concerned.(ii)For capital projects, the costs include the actual direct expenditure and staff costs for design, planning and supervision during the construction period.(iii)All other fixed assets are stated at cost less accumulated depreciation except assets under construction which are stated at cost.
-
(c)
Depreciation(i)Depreciation is provided on a straight-line basis calculated to write off the cost of assets less residual value over their estimated useful lives. The annual rates of depreciation used are: –(ii)
Tunnels, dams, resumption and afforestation, etc. 1% Civil engineering works 2% Water mains – fresh
– salt2%
5%Mechanical/electrical works, plant and machinery 4%-14.29% Meters 8.33% Computer hardware, software and system 10% Motor vehicles 10%-20% No depreciation is provided on assets under construction. -
(d)
Stocks
Stocks are stated at the lower of cost and net realisable value, using the weighted average cost method to the extent that it is material.
-
(e)
Taxation
Notional profits tax is provided, where necessary, based on the expected taxable surplus for the year, using the tax rates prevailing at the balance sheet date, and any adjustments to tax payable in respect of previous years. No provision for notional profits tax has been made in the accounts as the Authority has no taxable surplus for the year.
-
(f)
Deferred Tax
Deferred tax is recognised, where appropriate, for all material temporary differences between the tax bases of assets and liabilities and their carrying amounts in the accounts. Deferred tax assets are recognised to the extent that it is probable that taxable surplus will be available against which the temporary differences can be utilised. No provision for deferred tax in respect of all material temporary differences has been made in the accounts as the Authority has no taxable surplus against which the temporary differences can be utilised.
-
(g)
Employee Benefits
Employee benefits including salaries, gratuities, pensions, housing benefits and annual leave are accrued and recognised as an expense in the year in which the associated services are rendered by employees.
-
(h)
Actual Return on ANFA
This is calculated as a percentage of surplus/deficit after taxation to average net fixed assets (ANFA).
-
(i)
Average Net Fixed Assets
The average net fixed assets (ANFA) represents the simple average of the opening and closing value of total fixed assets less aggregate depreciation.
-
(j)
Deficit
Since the Water Authority does not have a separate legal identity, its financial resources form part of the General Revenue. All deficits are deemed to be financed by the General Revenue and adjusted to the Public Capital Account of the Authority.
2. Revenue
| 2014 | 2013 | |
|---|---|---|
| $M | $M | |
| Chargeable supplies | 2,555.8 | 2,527.2 |
| Contribution from rates | 2,236.4 | 1,680.4 |
| Contribution from Government on concessions | 1,734.2 | 1,880.6 |
| Contribution from Government on free allowance to consumers | 918.7 | 912.4 |
| Supplies to Government establishments | 159.0 | 156.2 |
| Fees, licences and reimbursable works | 22.7 | 25.1 |
| Interest from deposits | 3.8 | 5.9 |
| 7,630.6 | 7,187.8 |
The contribution from Government on concessions is to cover the shortfall in contribution from rates resulting from the concession of rates granted during the years.
3. Expenditure
| 2014 | 2013 | |
|---|---|---|
| $M | $M | |
| Staff costs | 1,528.7 | 1,486.0 |
| Operating and administration expenses | 1,747.9 | 1,698.3 |
| Purchase cost of Dongjiang water | 3,802.2 | 3,594.5 |
| Depreciation | 1,482.7 | 1,416.7 |
| 8,561.5 | 8,195.5 |
4. Taxation
| 2014 | 2013 | |
|---|---|---|
| $M | $M | |
| Notional profits tax charge for the year | 0.0 | 0.0 |
| Deferred tax assets/(liabilities) not recognized in respect of:– | ||
| Unused tax loss | 26,969.9 | 24,626.6 |
| Material temporary difference arising from depreciation allowances | (18,415.3) | (16,998.6) |
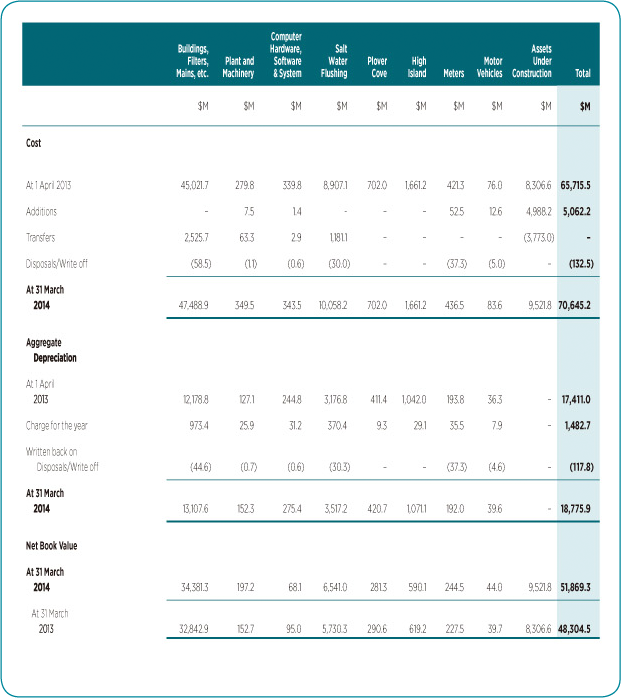
5. Fixed Assets
6. Current Assets
| 2014 | 2013 | |
|---|---|---|
| $M | $M | |
| Stocks | 106.2 | 105.3 |
| Debtors | 479.8 | 520.9 |
| Current account with Treasury | 1,841.4 | 1,681.7 |
| 2,427.4 | 2,307.9 |
7. Current Liabilities
| 2014 | 2013 | |
|---|---|---|
| $M | $M | |
| Consumers’ and contractors’ deposits | 1,870.6 | 1,774.1 |
| Creditors | 372.6 | 349.8 |
| 2,243.2 | 2,123.9 |
8. Public Capital Account
The Public Capital Account represents Government’s investment in this utility.
| 2014 | 2013 | |
|---|---|---|
| $M | $M | |
| Balance as at 1 April | 48,488.5 | 45,758.5 |
| Deficit for the year | (930.9) | (1,007.7) |
| Additional cash investment by the Government | 4,495.9 | 3,737.7 |
| Balance as at 31 March | 52,053.5 | 48,488.5 |
9. Capital Commitments
As at 31 March 2014, the Authority had capital commitments, so far as not provided for in the Operating Accounts, as follows:
| 2014 | 2013 | |
|---|---|---|
| $M | $M | |
| Contracted for | 10,654.5 | 11,708.1 |
| Authorised but not contracted for | 6,735.9 | 3,076.6 |
| 17,390.4 | 14,784.7 |
Financial Year: April 1 to March 31
Year (Calendar Year): January 1 to December 31
Exchange RatesWhen dollars are quoted in this report, they are, unless otherwise stated, in Hong Kong dollars. Since October 17, 1983, the Hong Kong dollar has been linked to the US dollar, through an arrangement in the note-issue mechanism, at a fixed rate of HK$7.80 = US$1.