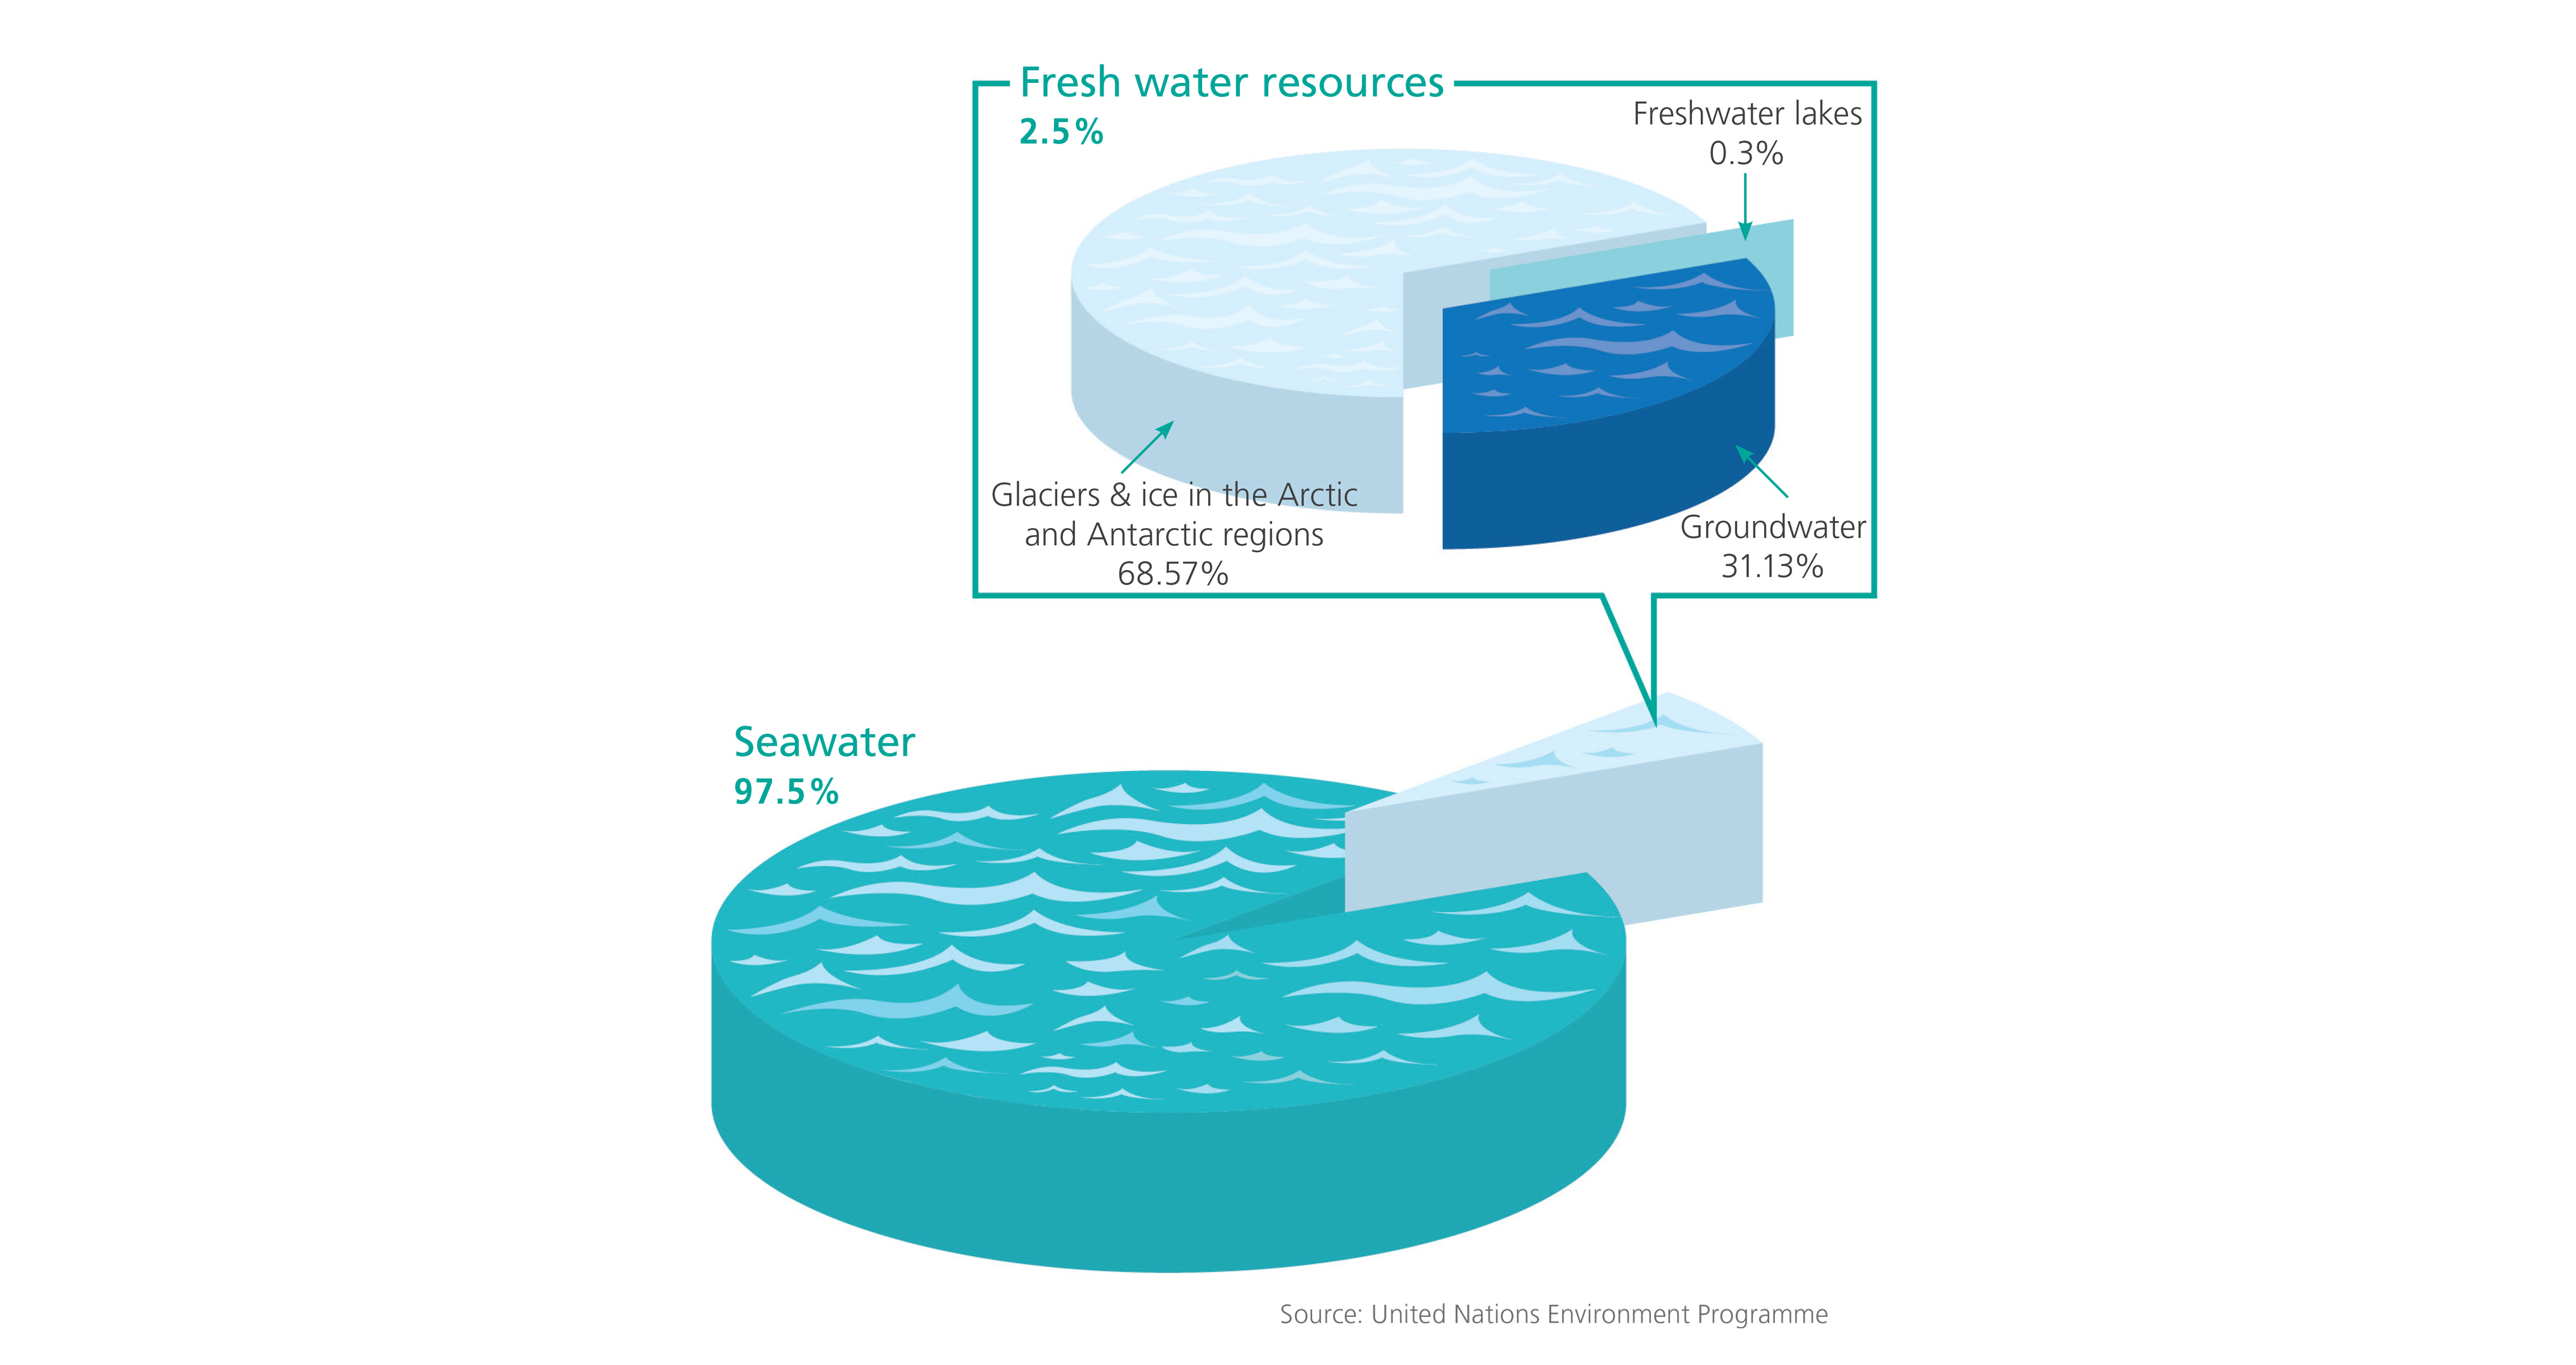
There is possibly a strong impression that the world’s water resources appear abundant and inexhaustible, as nearly 70% of the earth’s surface is covered by water. However, 97% of the 1.4 billion cubic kilometres of earth’s water is seawater, which is highly saline and therefore non-potable. Of the remaining fresh water, nearly 70% is difficult to access as it is contained in glaciers and in the permanent snow and ice of the Arctic and Antarctic regions. Furthermore, around 30% of the world’s fresh water is stored as groundwater. It is the remaining - less than 1% - in the form of surface water such as freshwater lakes and rivers that is available worldwide as fresh water resources.
The geographical distribution of water is highly uneven, with more than half of the world's fresh water concentrated in nine countries: Russia, China, India, Indonesia, Peru, Brazil, Colombia, the United States and Canada. According to the United Nations World Water Development Report 2018, more than half of the world's population (between 4.8 to 5.7 billion people) will live in water-scarce areas by 2050. Facing climate change and increasing water demand, water scarcity will be a serious challenge for the world; neither will Hong Kong escape this issue.
Global Distribution of Water Resources
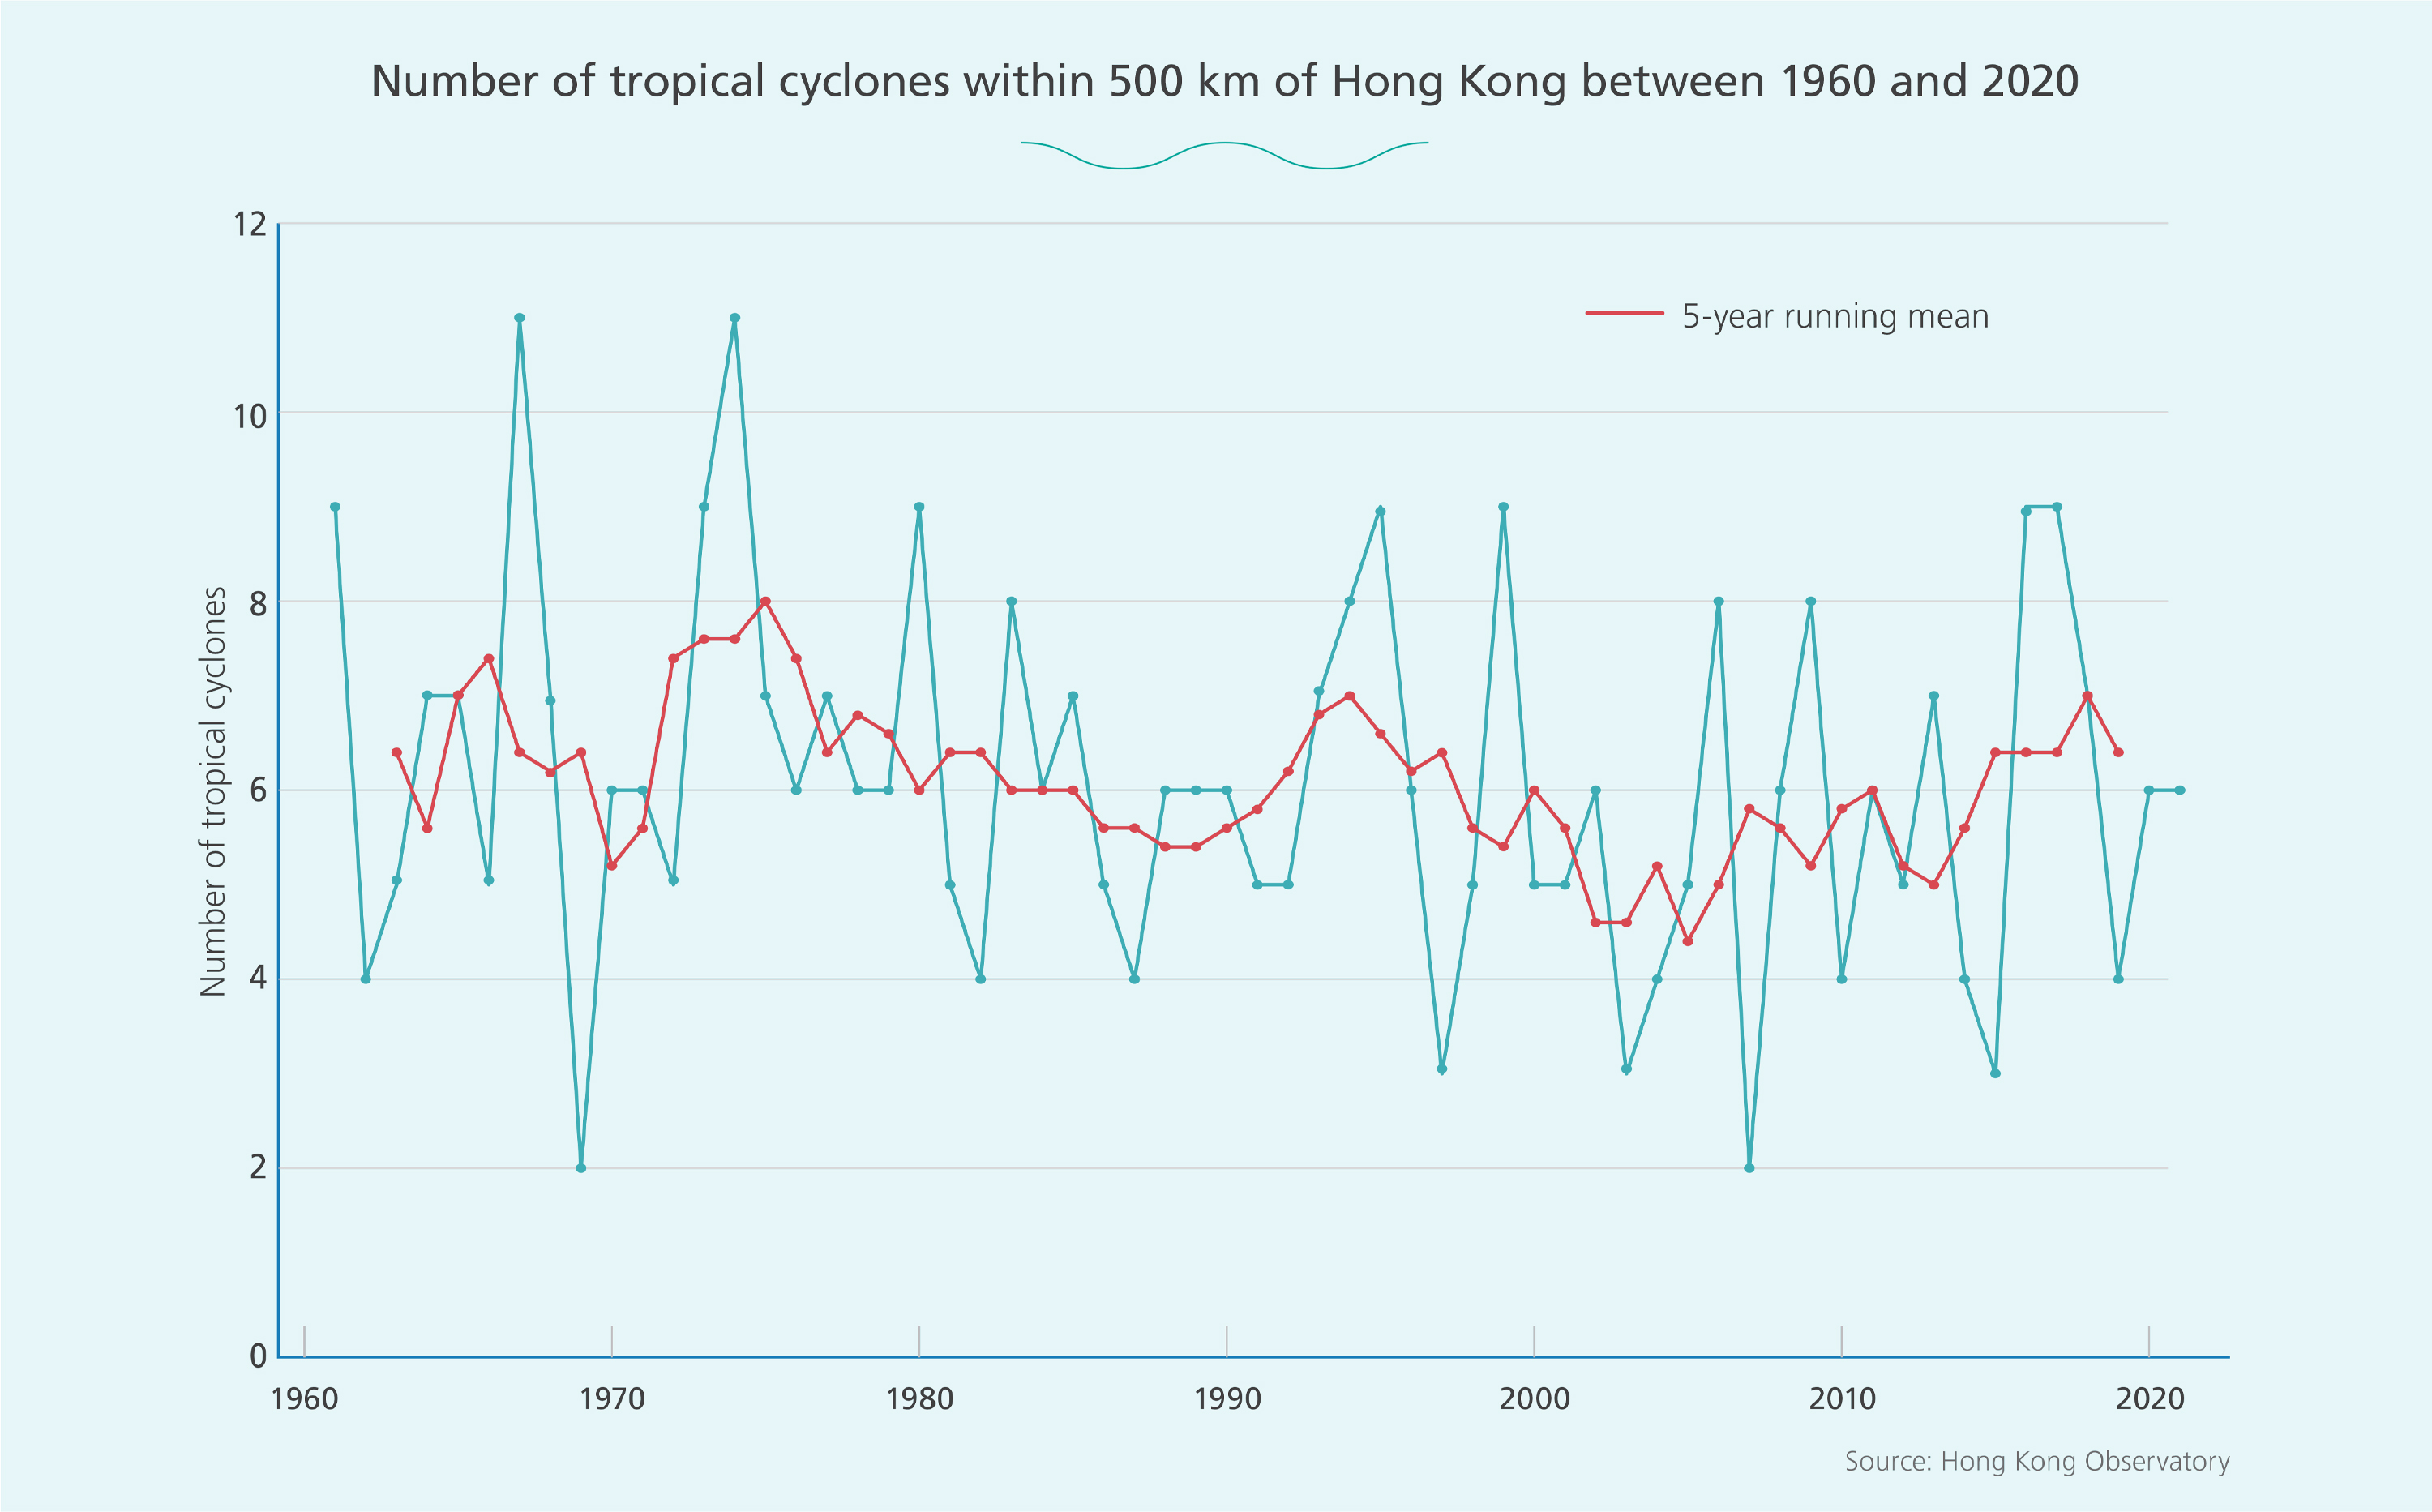
Hong Kong’s fresh water supply is mainly sourced from rainwater, both from Dongjiang water and local yields. So, any change in rainfall patterns due to climate change may affect the supply of fresh water in Hong Kong and neighbouring areas. Since the 19th century, human activity, especially the use of fossil fuels, has been the primary cause of climate change - which is defined as long-term changes in temperature and weather patterns. This activity has led to an increase in the concentration of greenhouse gases in the atmosphere, increasingly trapping heat. Consequently, global warming has weakened the region’s cold fronts blowing south from the north. Some Taiwanese meteorologists have found that over the past 30 years, the East Asian Monsoon - or plum rain - in Southeast Asia has shifted northwards from its original 20 to 30 degrees north latitude to a latitude more northward of 30 degrees north latitude. Located at 22.3 degrees north latitude, Hong Kong may experience a significant future reduction in rainfall during the traditionally rainy months of May and June due to this shift. Also, the number of tropical cyclones within 500 km of Hong Kong has been declining over the 50-year period between 1961 and 2009. Therefore, the amount of rainfall accompanying tropical cyclones is likely to decrease in the future, suggesting that Hong Kong will likely experience significant changes in its future rainfall patterns.
As a result of world population and economic growth, the global demand for water has also been trending upward. According to the United Nations World Water Development Report 2018, the world's population is expected to increase from 7.7 billion in 2017 to between 9.4 and 10.2 billion by 2050. Global Gross Domestic Product (GDP) is expected to increase by 2.5 times over the same period. The report estimates that global water demand will increase by 20% to 30%, from about 46 trillion cubic metres (tcm) per year in 2017 to 55 tcm to 60 tcm in 2050.
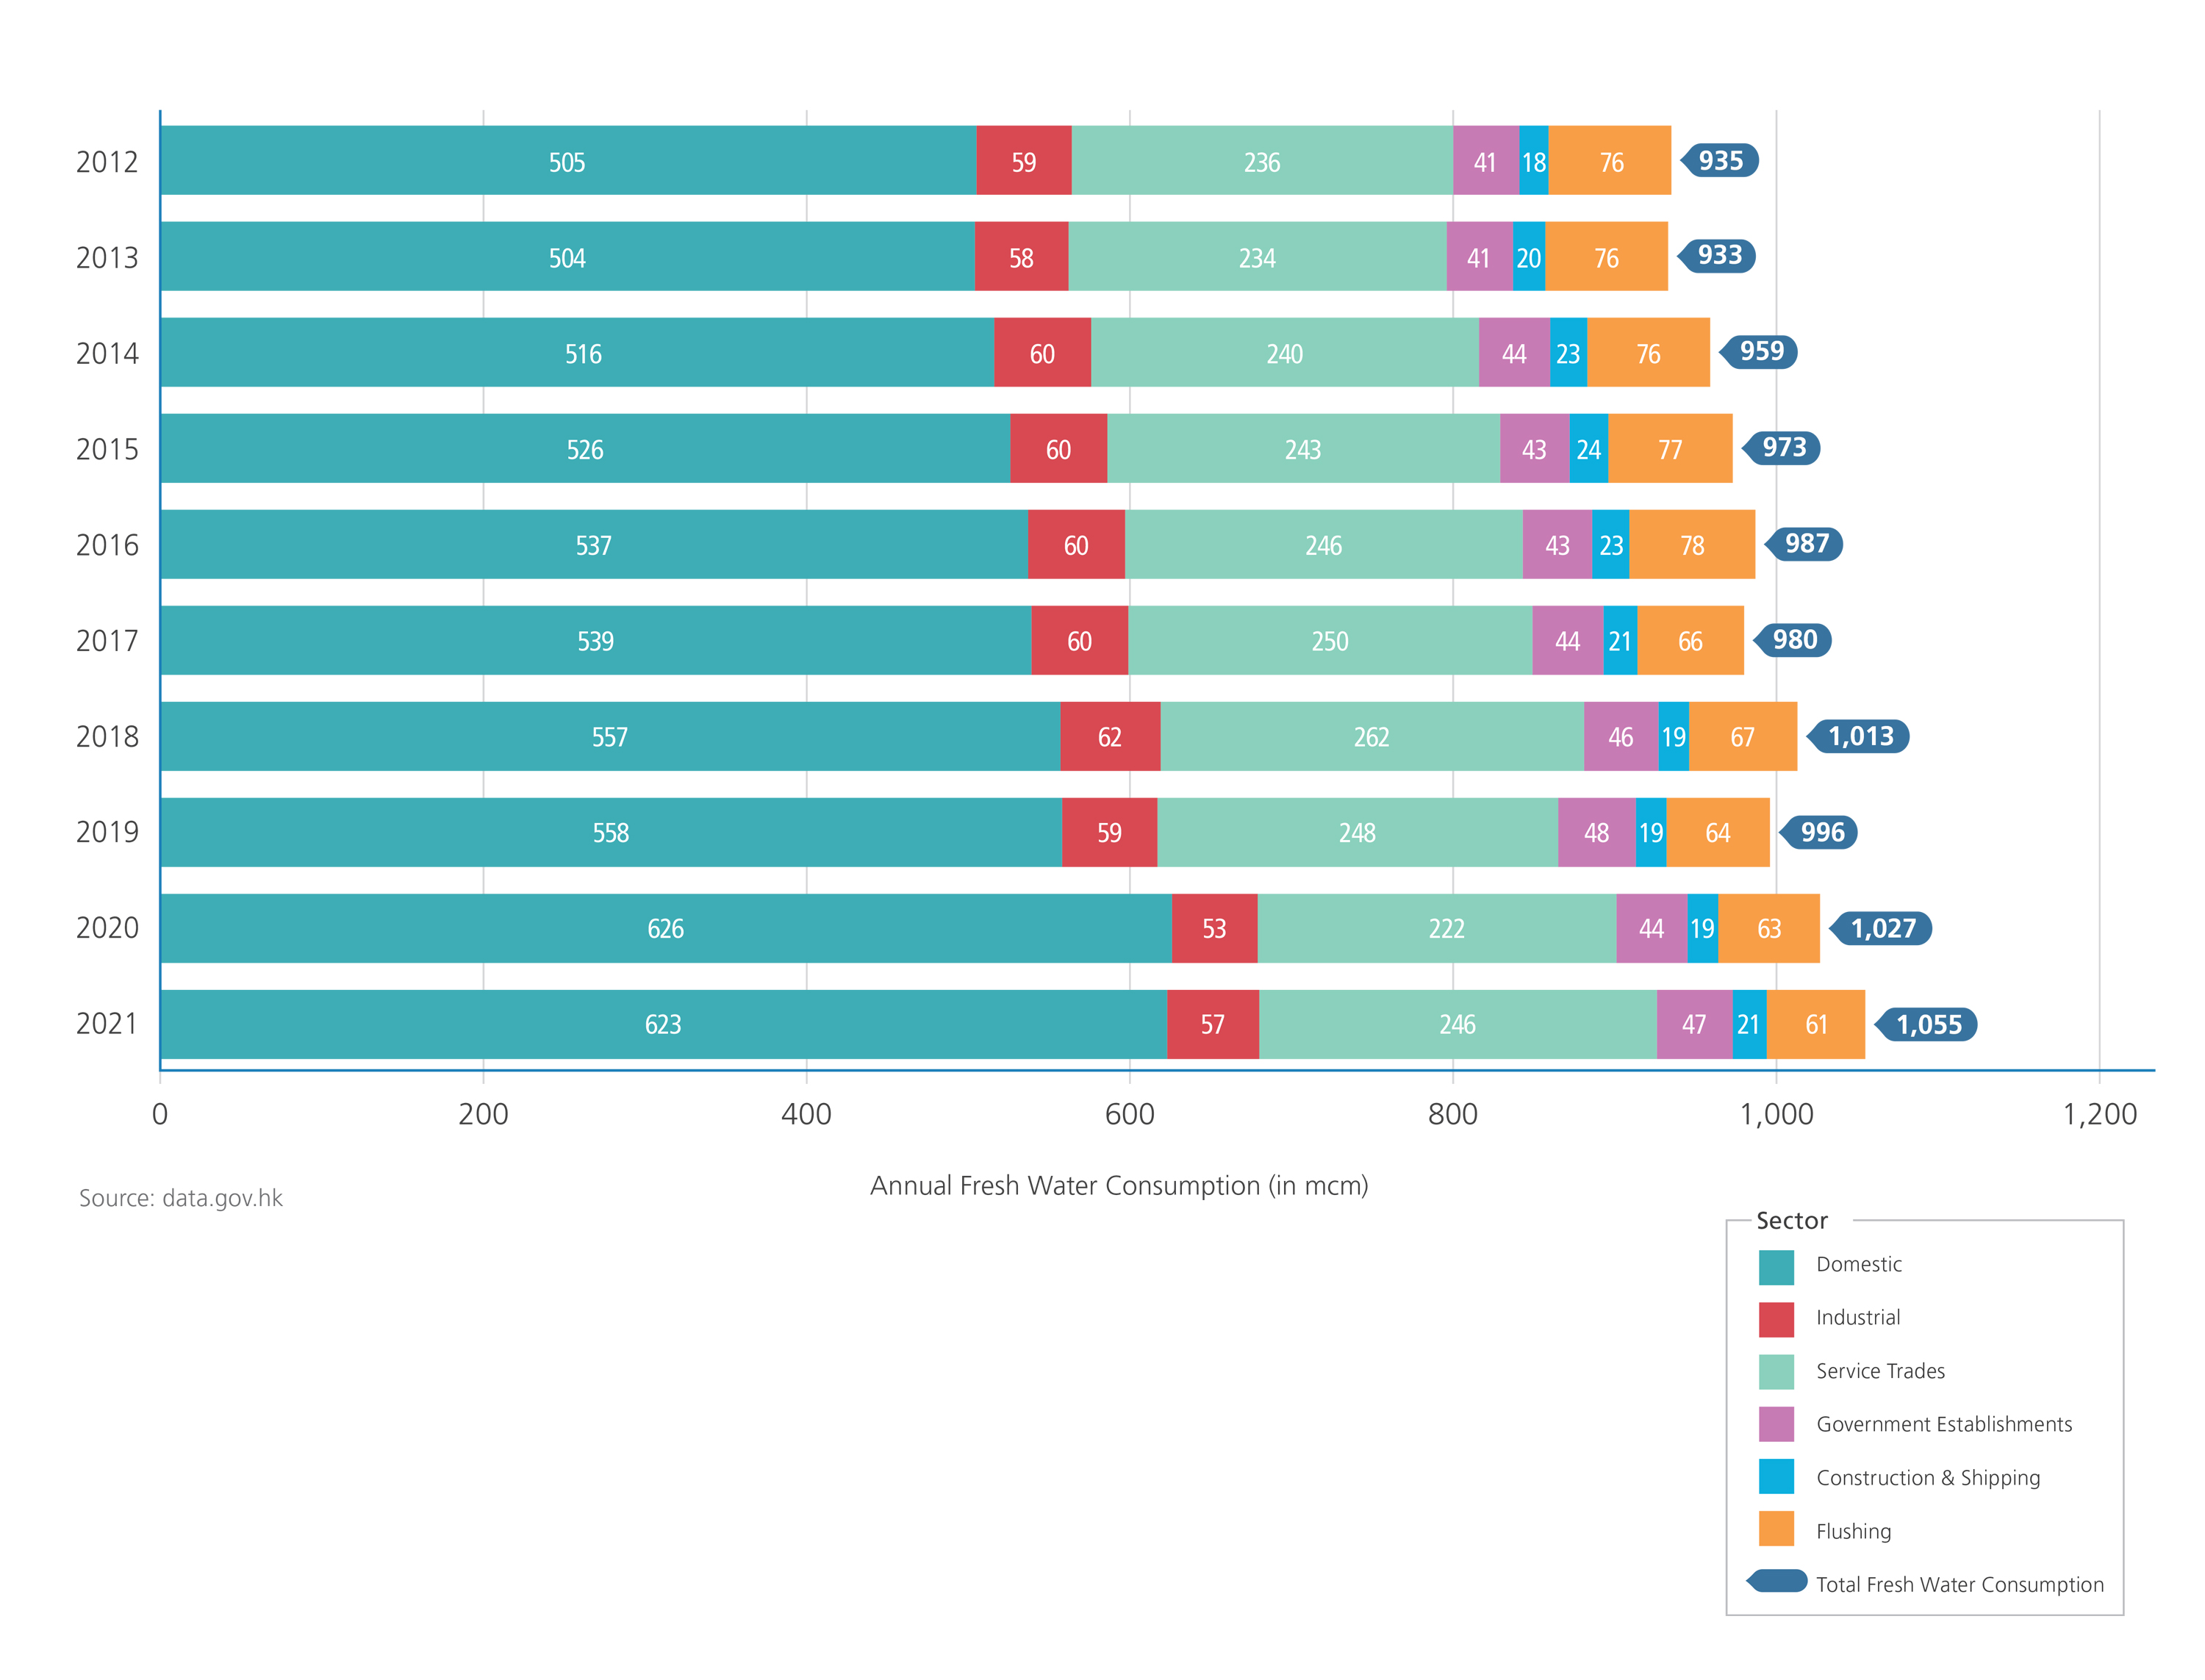
Dongjiang water supplies 70% to 80% of Hong Kong's fresh water and is also a major source of fresh water for southern China. As the Pearl River Delta further develops as a processing and export base, the region faces the challenge of competing water resources, creating uncertainties over future water supply. At the same time, water consumption in Hong Kong has increased significantly. The population of Hong Kong has increased from 5.52 million in 1986 to over 7.42 million in 2020, and its GDP has increased almost nine-fold from $31,256.1 billion to $271,073 billion over the same period. Due to population and economic growth, the total water consumption in Hong Kong has significantly increased, from 935 million cubic metres (mcm) in 2012 to 1,055 mcm in 2021. In recent years, Hong Kong’s average daily fresh water consumption per capita has been around 130 litres, with bathing and laundry accounting for about 40% and 10% of water consumption respectively. Cooking and other purposes account for the remaining 50%. There has been no significant changes in these water consumption proportions over the years.
The government’s 2017 policy agenda proposed for the first time a target for reducing Hong Kong’s fresh water consumption by 10% per capita by 2030 at the earliest1. The preceding chapters outlined a series of measures introduced by the WSD in recent years for the sustainable development of water resources. These measures include expanding the use of lower grade water, reducing water losses from distribution networks, regulating water leakage in private properties and ensuring water efficiency. Apart from these practical measures to exploit new water resources and reduce water consumption, it is also important to intensify public education and publicity to build up awareness and encourage better water conservation habits.
The chart below illustrates that domestic water is the primary source of water consumption in Hong Kong, accounting for about 55% of the total water consumed. The industrial, commercial and service sectors follow closely behind. In 2016, the WSD introduced the Best Practice Guidelines for Water Usage for the catering and hotel industries, two of the city’s largest water-consuming industries.
Annual Fresh Water Consumption (by Sector) 2012 - 2021
Further initiatives to improve water efficiency among non-domestic users include the first “ECH2O - Enterprises Cherish Water Campaign" organised by the WSD in 2021. This campaign aims to create a collaborative platform for the industrial and commercial sectors to promote water conservation through initiatives such as: signing the ECH2O Charter, appointing ECH2O managers, education and promotion, equipment improvement and recognition programmes.
- Support the ECH2O - Enterprises Cherish Water Campaign to cherish water
- Appoint staff as ECH2O manager to manage water consumption
- Promote practices and behavioural changes to cherish water
- Participate in Water Efficiency Benchmarking
- Set water saving targets
- Promote and adopt efficient water consuming devices
Appointed staff will help promote the campaign on his/ her responsible premises, duties include:
- Arrange the installation of flow controllers supplied by the WSD in premises under their management
- Monitor water consumption and update on the water cherishing progress of the premises
- Promote the adoption of water-consuming devices with the Grades 1 or 2 “Water Efficiency Labelling Scheme (WELS)”
- Assist in providing data (e.g. flow of people) to calculate the Water Efficiency Index
- Provide venues for exhibitions or promotions for water cherishing
- Attend workshops to learn the latest water cherishing knowledge
- Share successful cases of water cherishing with other ECH2O managers
Water is not only used for direct consumption but also in many economic activities, particularly in food production. “Virtual water” is the amount of water used in the production and/or transportation of products and quantifies water consumption that is not visible. For instance, producing one kilogram (kg) of wheat requires about 1,000 litres of water. Therefore, one kg of wheat requires 1,000 litres of virtual water. The diagram below provides a concise overview of the virtual water used to produce one kg of beef:


Virtual Water Consumed in the Production of Different Food, Drinks and Consumer Goods

per kg of chocolate

per kg of coffee beans

per kg of beef
per kg of chicken

per kg of rice

per kg of bread

per litre of coffee
per litre of milk

per kg of bananas

per kg of apples
per kg of lettuce

per car

per cotton shirt
per pair of leather shoes

per pair of jeans

per smartphone
Individuals can reduce their virtual water consumption in their daily lives by wisely shopping, spending and choosing environment-friendly transportation means.
To learn more about the virtual water consumption of different consumer products, please use the water footprint calculator website below:
- Using 2016 as the base year