Key Performance Indicators
Financial Year (Percentage)
| Indicators | 12/13 | 13/14 | 14/15 |
|---|---|---|---|
| Fresh Water Quality – up to the connection points
[100% compliant with WHO’s “Guidelines for Drinking-water Quality” (2011#)] |
100 | 100 | 100 |
| Salt Water Quality – up to the connection points
[96% compliant with WSD Water Quality Objectives] |
complied with | complied with | complied with |
| Fresh Water Supply Pressure (15 – 30 metres) λ | 100 | 100 | 100 |
| Salt Water Supply Pressure (15 metres) λ | 100 | 100 | 100 |
Financial Year (Percentage)
| Indicators | 12/13 | 13/14 | 14/15 |
|---|---|---|---|
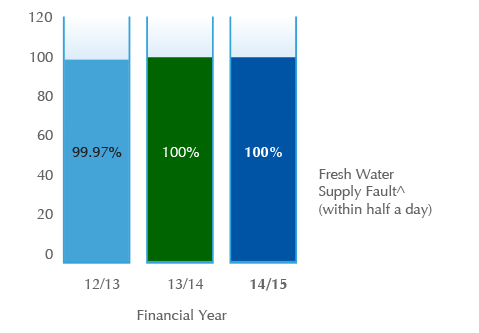
| Response time for Attendance to Fault Complaints | |||
| Fresh Water Supply Fault^ (within half a day) | 99.97 | 100 | 100 |
| Others (within a working day) | 99.97 | 100 | 100 |
| Duration of Suspension of Water Supply for Planned Works
(97% within 8 hours) |
complied with | complied with | complied with |
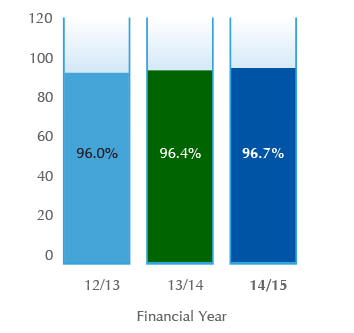
| Accuracy of Water Meters
@
(inaccuracy not exceeding ± 3%) |
96 | 96.4 | 96.7 |
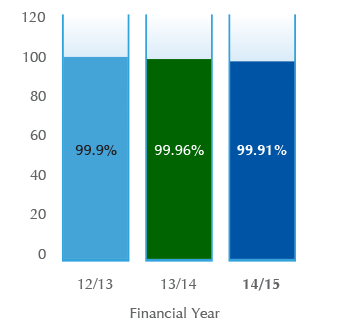
| Interim Reply to Correspondence from the Public (10 Calendar Days) | 99.9 | 99.96 | 99.91 |
# The 2011 WHO Guideline standards were adopted in August 2012.
λ Minimum residual pressure (or pressure range) in the distribution systems except at their extremities.
^ Including cases of no fresh water supply; polluted fresh water supply; and internal fresh water pipe burst likely to cause flooding.
@ Water meters are deemed to register correctly if their inaccuracy does not exceed ± 3%.
Fresh Water Quality
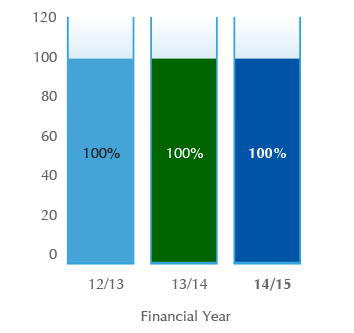
Fresh Water Supply Pressure
Salt Water Supply Pressure
Response Time for Attendance to Fault Complaints

Accuracy of Water Meters
Interim Reply to Correspondence from the Public